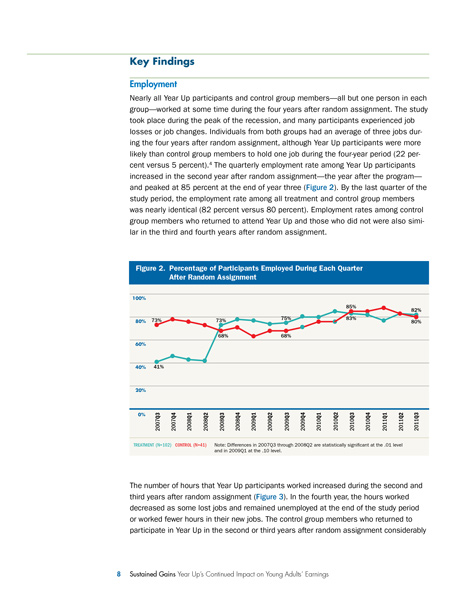
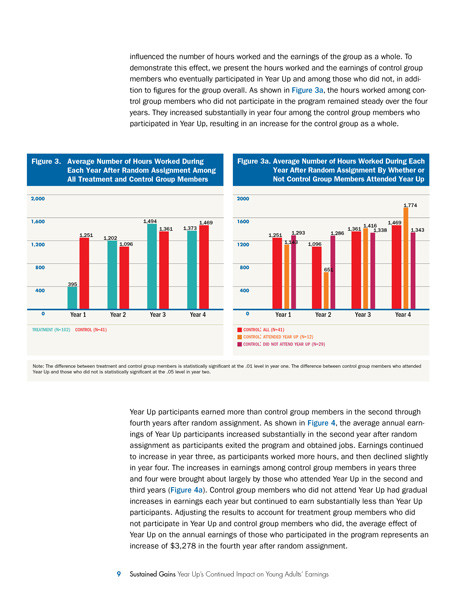
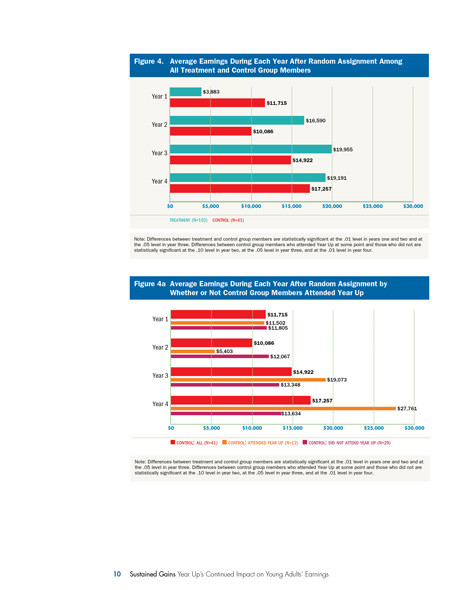
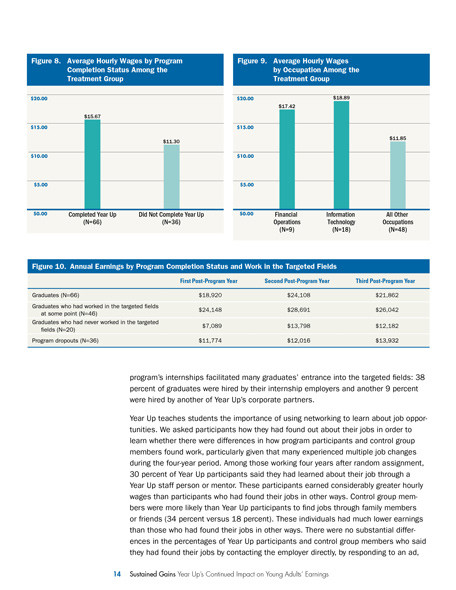
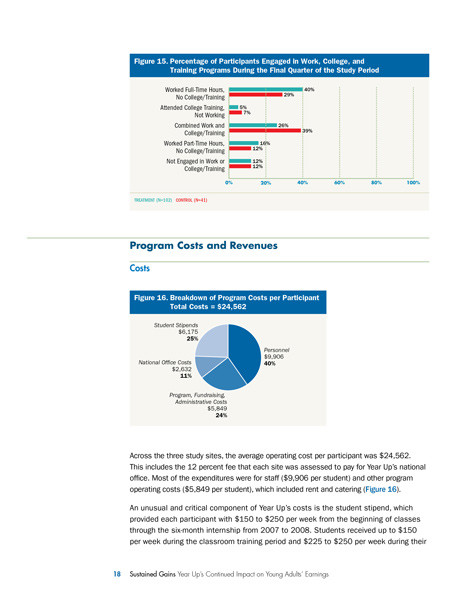
As a research group, the Economic Mobility Corporation publishes information about programs that will aid the disadvantaged. In addition to designing their logo, we helped Mobility to organize the evaluation of policies and opportunities into an electronic format, using charts, graphs, figures and tables to support the complex battery of data. Reflecting Mobility’s inclusivity, the report was designed to look beautiful and read easily, whether viewed on screen or printed by website visitors. We achieved this dual purpose by designing it to fit onto letter-sized paper when printed, while minimizing on-screen scrolling and maximizing typeface readability in both mediums.
Format: Online document. Briefs are various numbers of (8.5″ x 11″) pages.
